Federal Standards
Section 303d of the federal Clean Water Act requires every state to list its surface waters that do not meet federal standards for public safety, contact recreation, fitness for use by aquatic species and other wildlife, and the presence of specific pollutants.
In 2004, Plum Creek (Seg ID 1810) was listed as a 303d surface waterway in Texas with concerns over bacteria. Currently, there are more than 400 surface water segments in Texas on the 303d List, including creeks, canals, rivers, lakes, reservoirs, bayous, and tidal segments.
Plum Creek Watershed Plan is one of 31 active watershed protection plans in Texas that have been accepted by the US EPA.
Map of WPP in Texas: NPS Project Viewer
Plum Creek has high nutrient (nitrogen and phosphorus) concentrations and is impaired by high E. coli bacteria levels. According to the Texas Commission on Environmental Quality (TCEQ) Texas Water Quality Inventory and 303(d) List, Plum Creek does not meet water quality standards for aquatic life, contact recreation, and fish consumption. The TCEQ updates these data sets every two years.
Hindrances
Non-point source pollution does not come from a specific source. Instead, it originates from many places, or from a widespread area. We all contribute to non-point source pollution when we improperly use or dispose of fertilizers, pesticides, oils, grease, pet or animal wastes, and trash. In many communities, these pollutants are transported to local waterways via storm drains.
As rain flows over roads, sidewalks, and lawns, it can pick up debris, chemicals, dirt, and other pollutants in its path. This stormwater is NOT cleaned before it reaches campus creeks and lakes that connect to groundwater reservoirs. In Plum Creek and across the nation, polluted stormwater runoff is one of the greatest threats to clean water.
Non-point Sources of Pollution
- Sediments from construction, forestry operations and agricultural lands;
- Bacteria and microorganisms from failing septic systems and pet wastes;
- Nutrients (from fertilizers and yard debris) and pesticides from agricultural areas, golf courses, athletic fields and residential yards;
- Oil, grease, antifreeze, and metals washed from roads, parking lots and driveways;
- Toxic chemicals and cleaners that were not disposed of properly
- Litter thrown onto streets, sidewalks and beaches, or directly into the water by individuals.
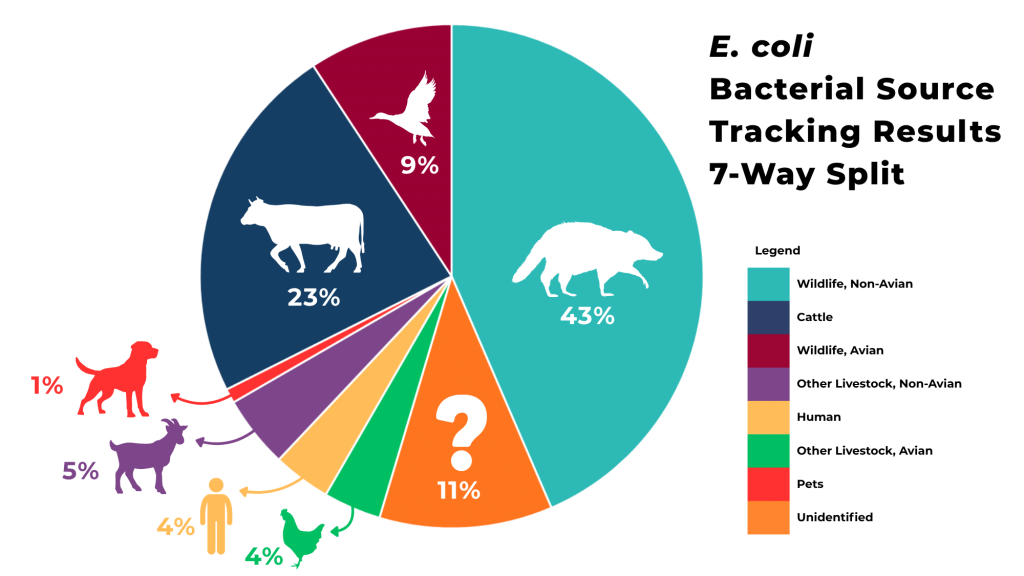
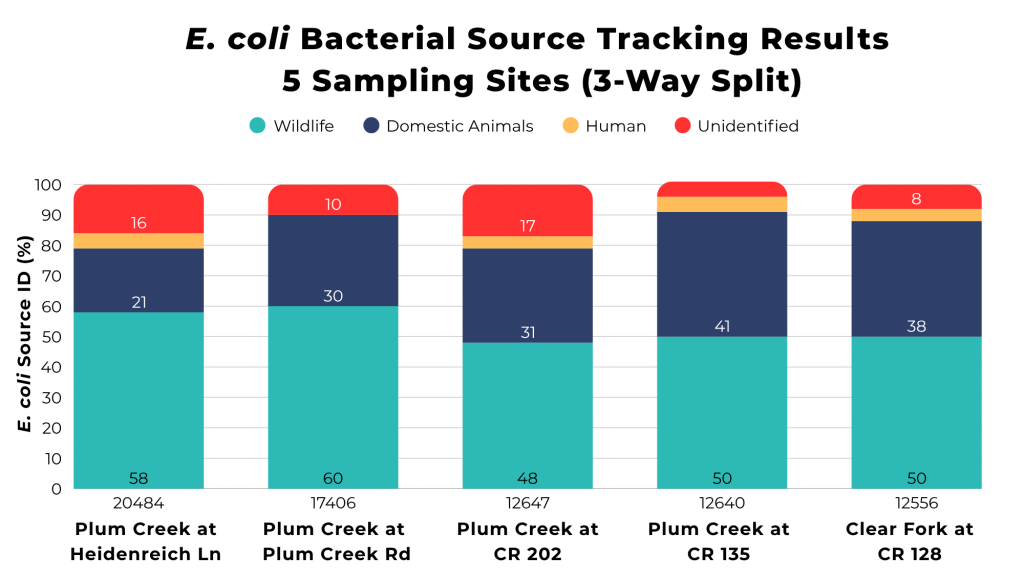
Bacterial Source Tracking
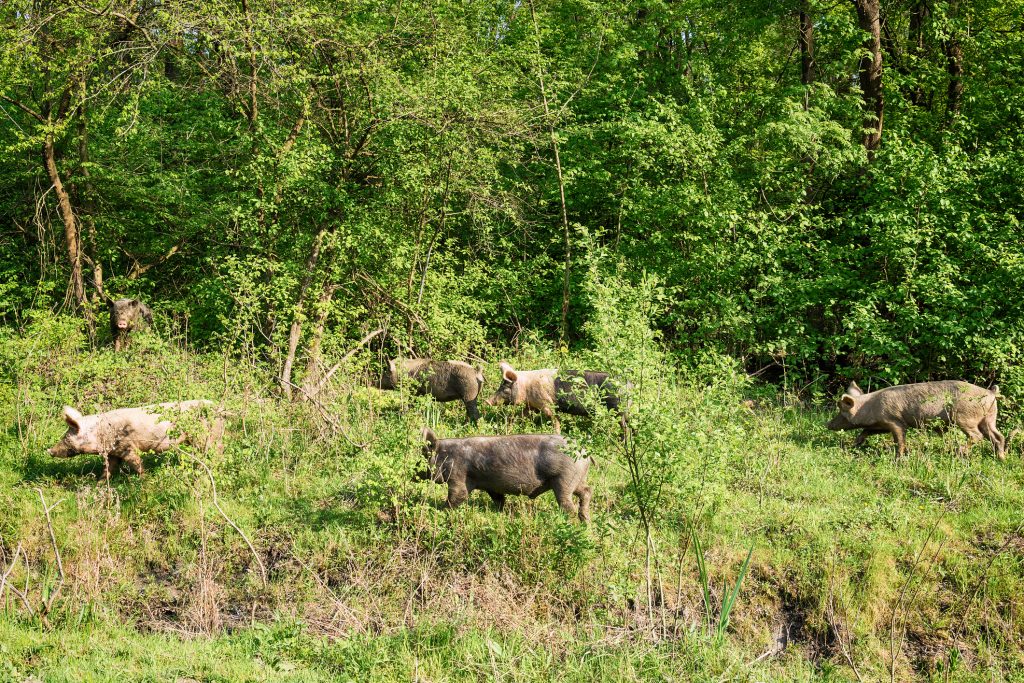
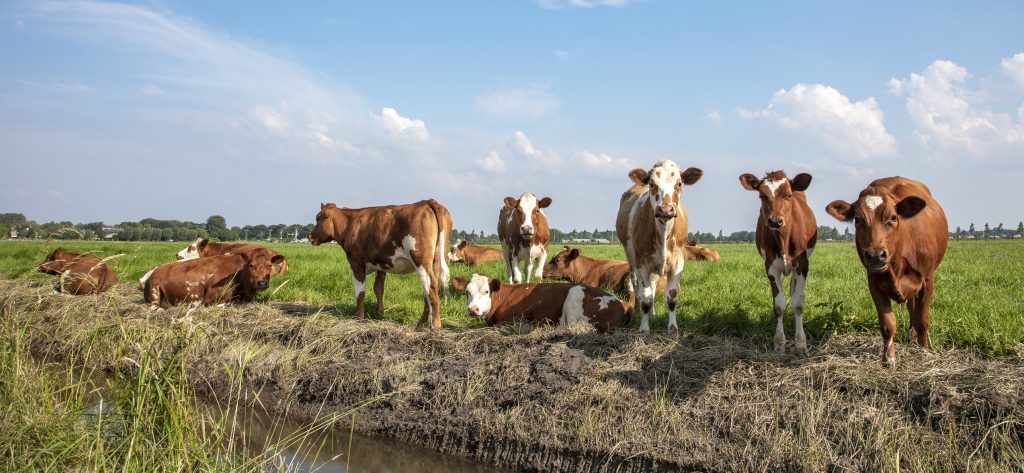
In 2016, Guadalupe-Blanco River Authority conducted a Bacterial Source Tracking study in the Plum Creek Watershed. A total of 60 samples were collected from five different locations over the 12-month sampling period. Samples were sent to Texas A&M University for source tracking analysis. Results from analysis of all 60 samples showed that wildlife was the biggest contributor to the E. coli throughout the watershed levels at 53%. Domesticated animals (livestock and pets) were the second largest contributor at 32%. 11% of samples could not be identified. Humans, likely through failing septic systems or wastewater treatment plants, accounted for 4%.
Texas Water Resources Institute released the report “Texas Bacterial Source Tracking Program Application, Expansion and Marker Evaluation (FY16-FY17)” in February of 2018. They analyzed over 20 watersheds across Texas to increase the accuracy and utility of the Texas E. coli Bacterial Source Tracking Library. Information regarding Plum Creek can be found on page 15.
Bacterial Source Tracking to Support the Implementation of the Plum Creek Watershed Protection Plan
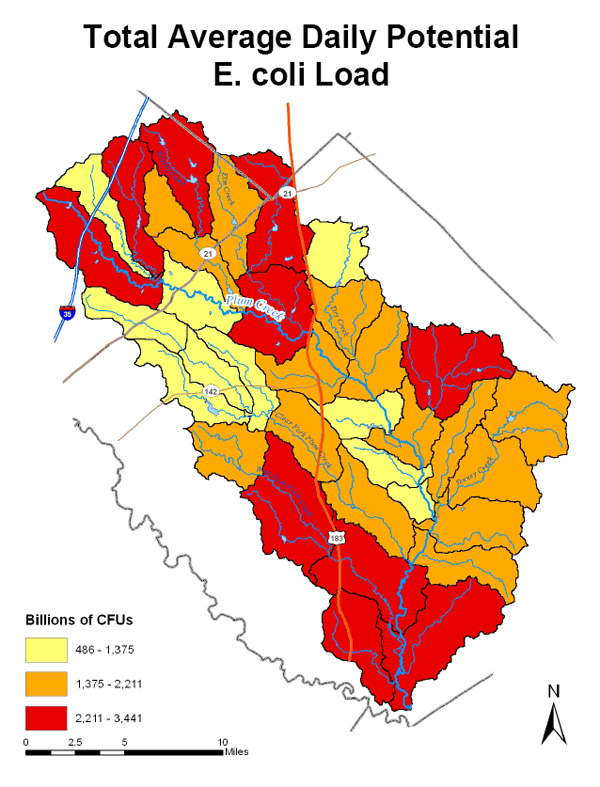
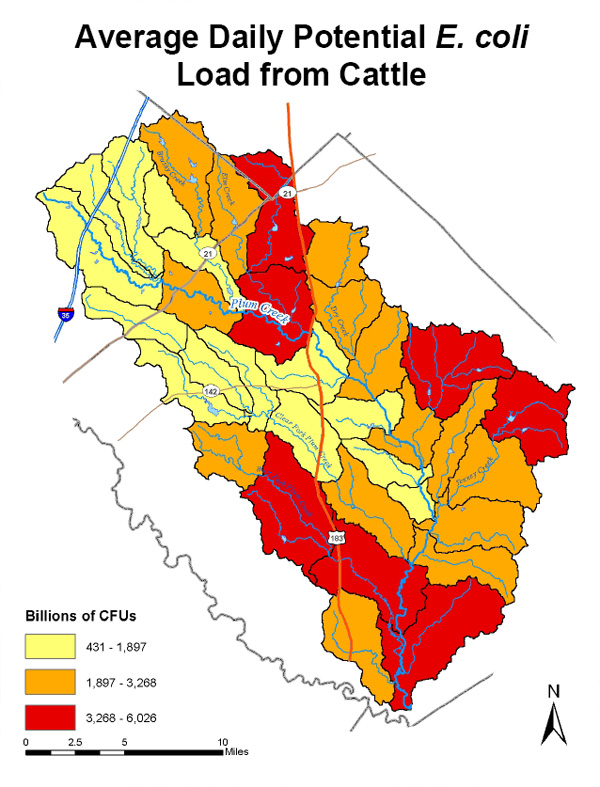
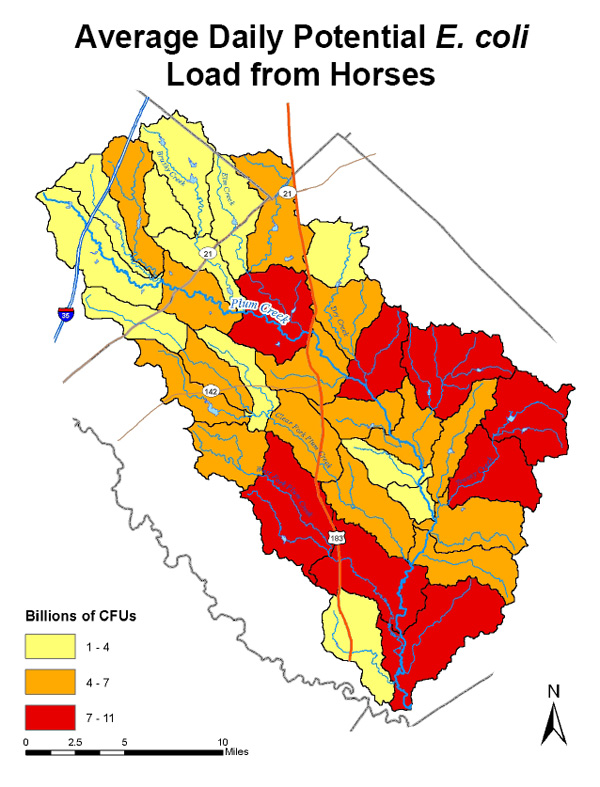
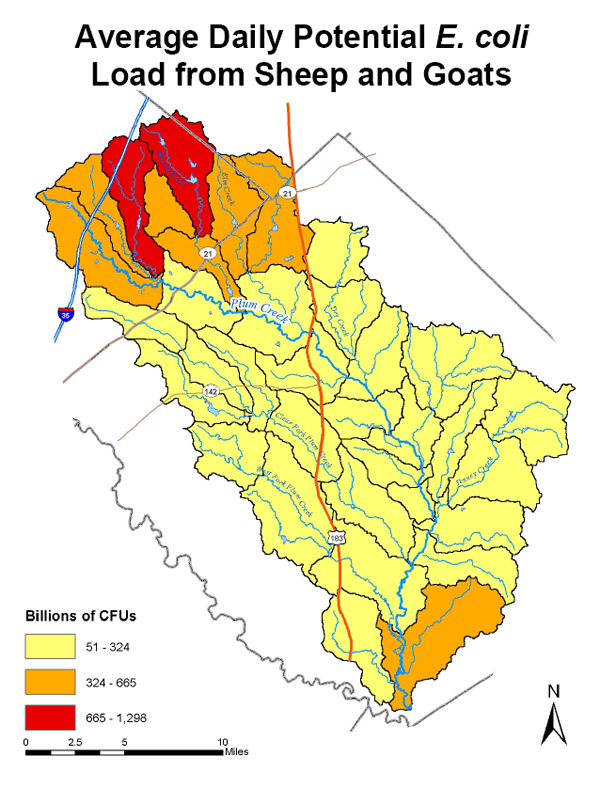
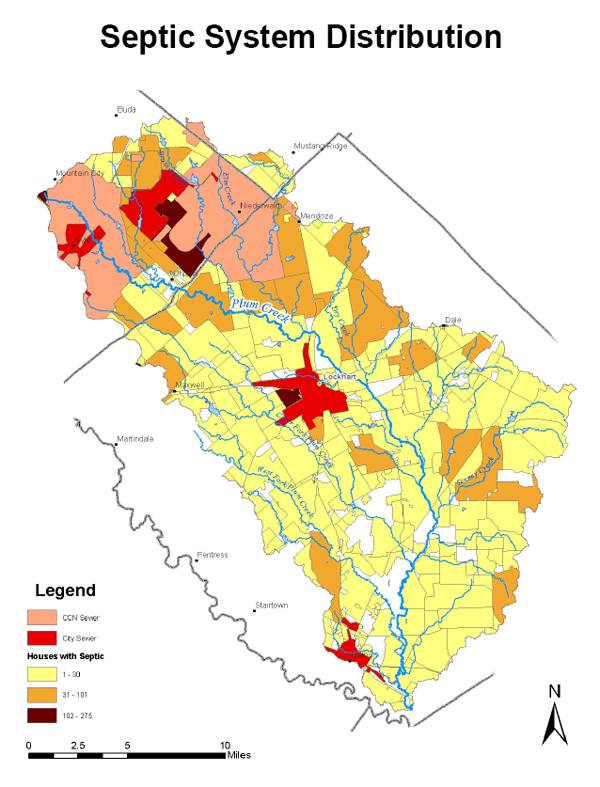
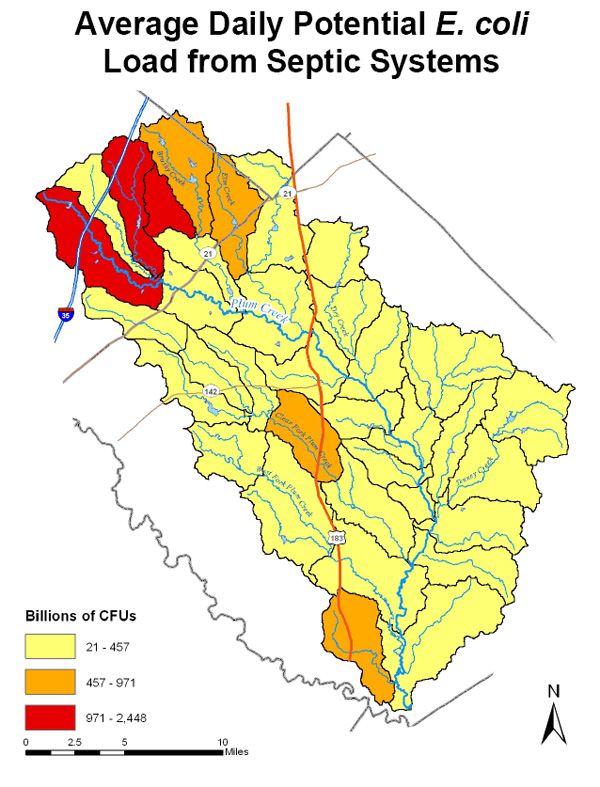
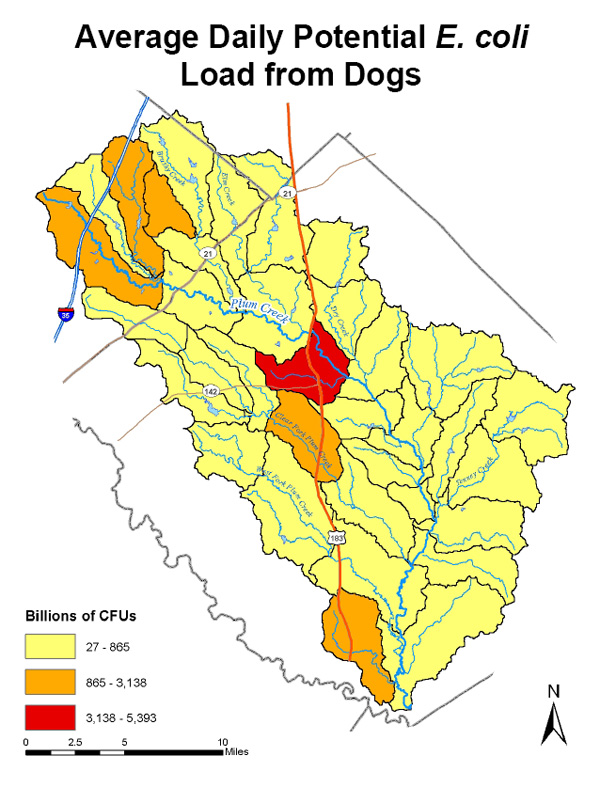
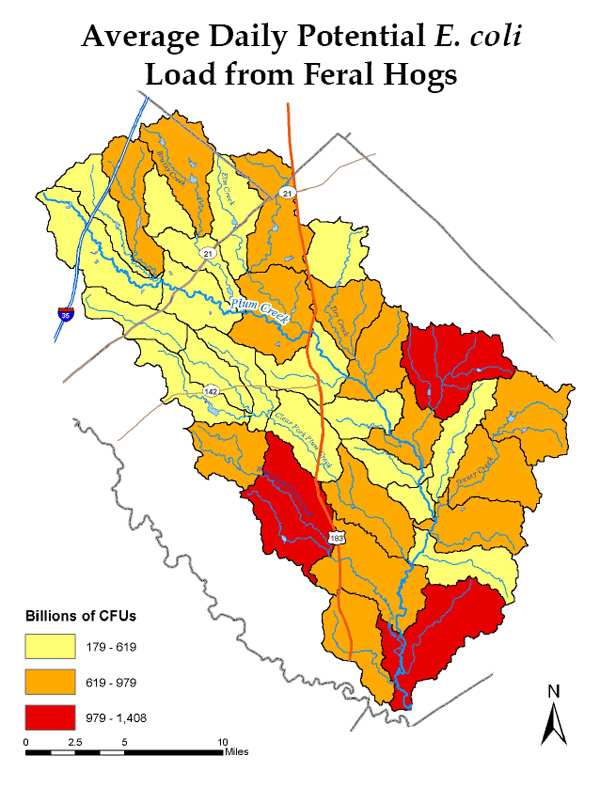
Bacteria Maps
Below are maps that document the sources and amounts of E. coli loading in the Plum Creek watershed in the from the initial Watershed Protection Plan assessment (2008).